8 Overlooked SEO Metrics for Growth (Updated for 2020)
Essential SEO Metrics for Your Business
Imagine you’re sailing on a boat in the Pacific Ocean. The boat is your business, the captain is you, and your survival and success depend on you making the right decision for reaching a certain point of the land.
 There are SEO metrics that contain important insights we often overlook: we either have no idea they exist, or we don’t know how to measure them, or both. These metrics are the same importance for your website as is a compass and wind speed for a sailboat captain — and well, we’ll let you use your imagination to take this analogy forward.
If you’re an entrepreneur or a business owner, read on: in this article, we are going to show you 8 essential metrics you should know and measure frequently in SEO tools. We’ll also explain what they mean for your website and demonstrate how you can put them to practice them on your Nightwatch graphs.
Let’s dive in!
Distribution of your top keywords
Keyword distribution represents how the ratio of your top 3, top 100, and non-ranking keywords is changing.
This graph not only shows if your selected keywords are distributed healthily but also gives you an idea of how stable your rankings in different ranges are, which makes it especially beneficial when tracking changes on large enterprise websites.
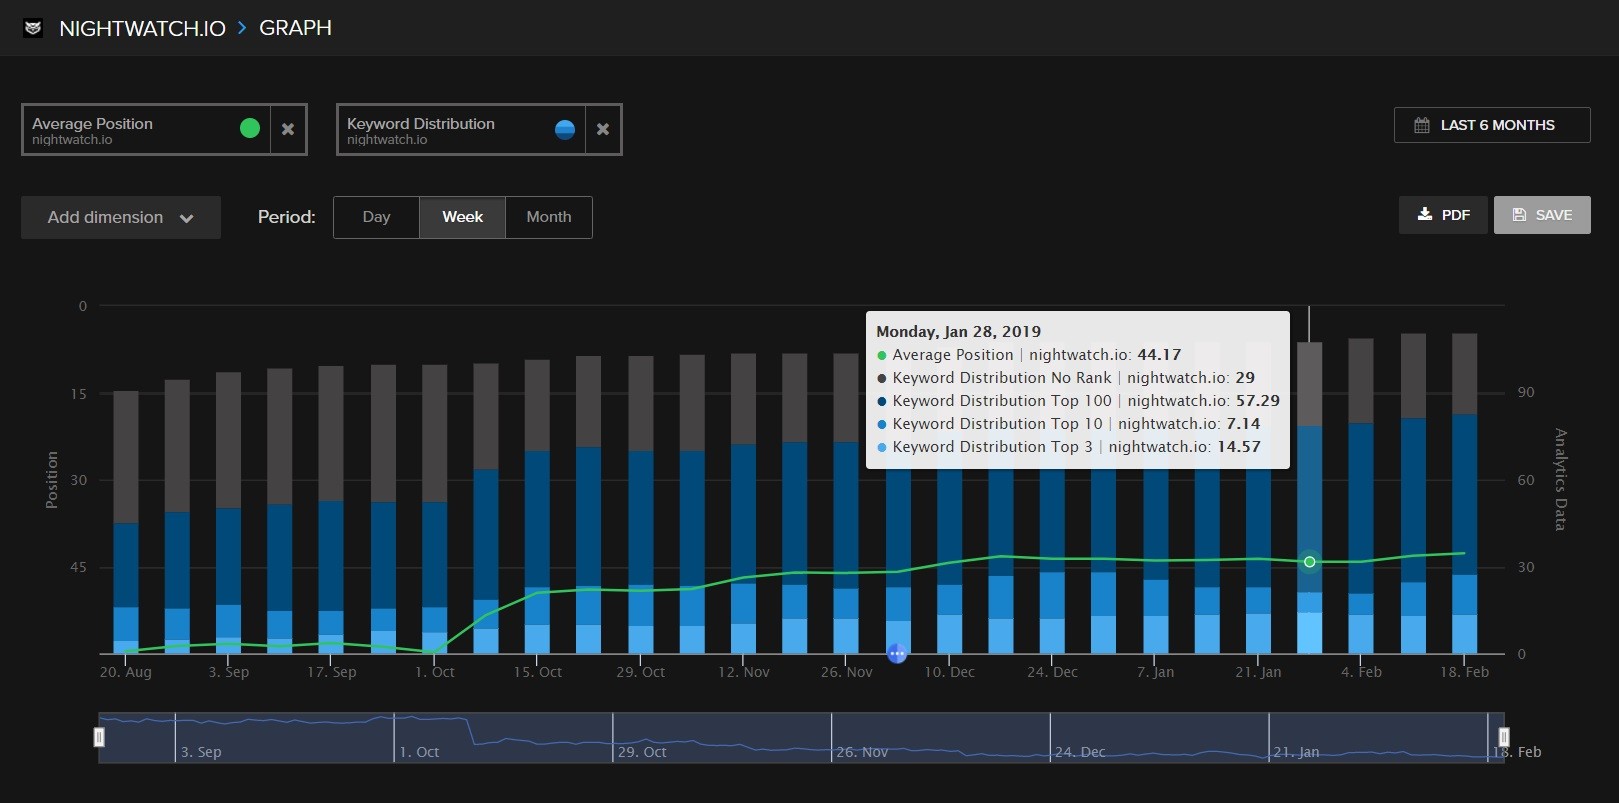
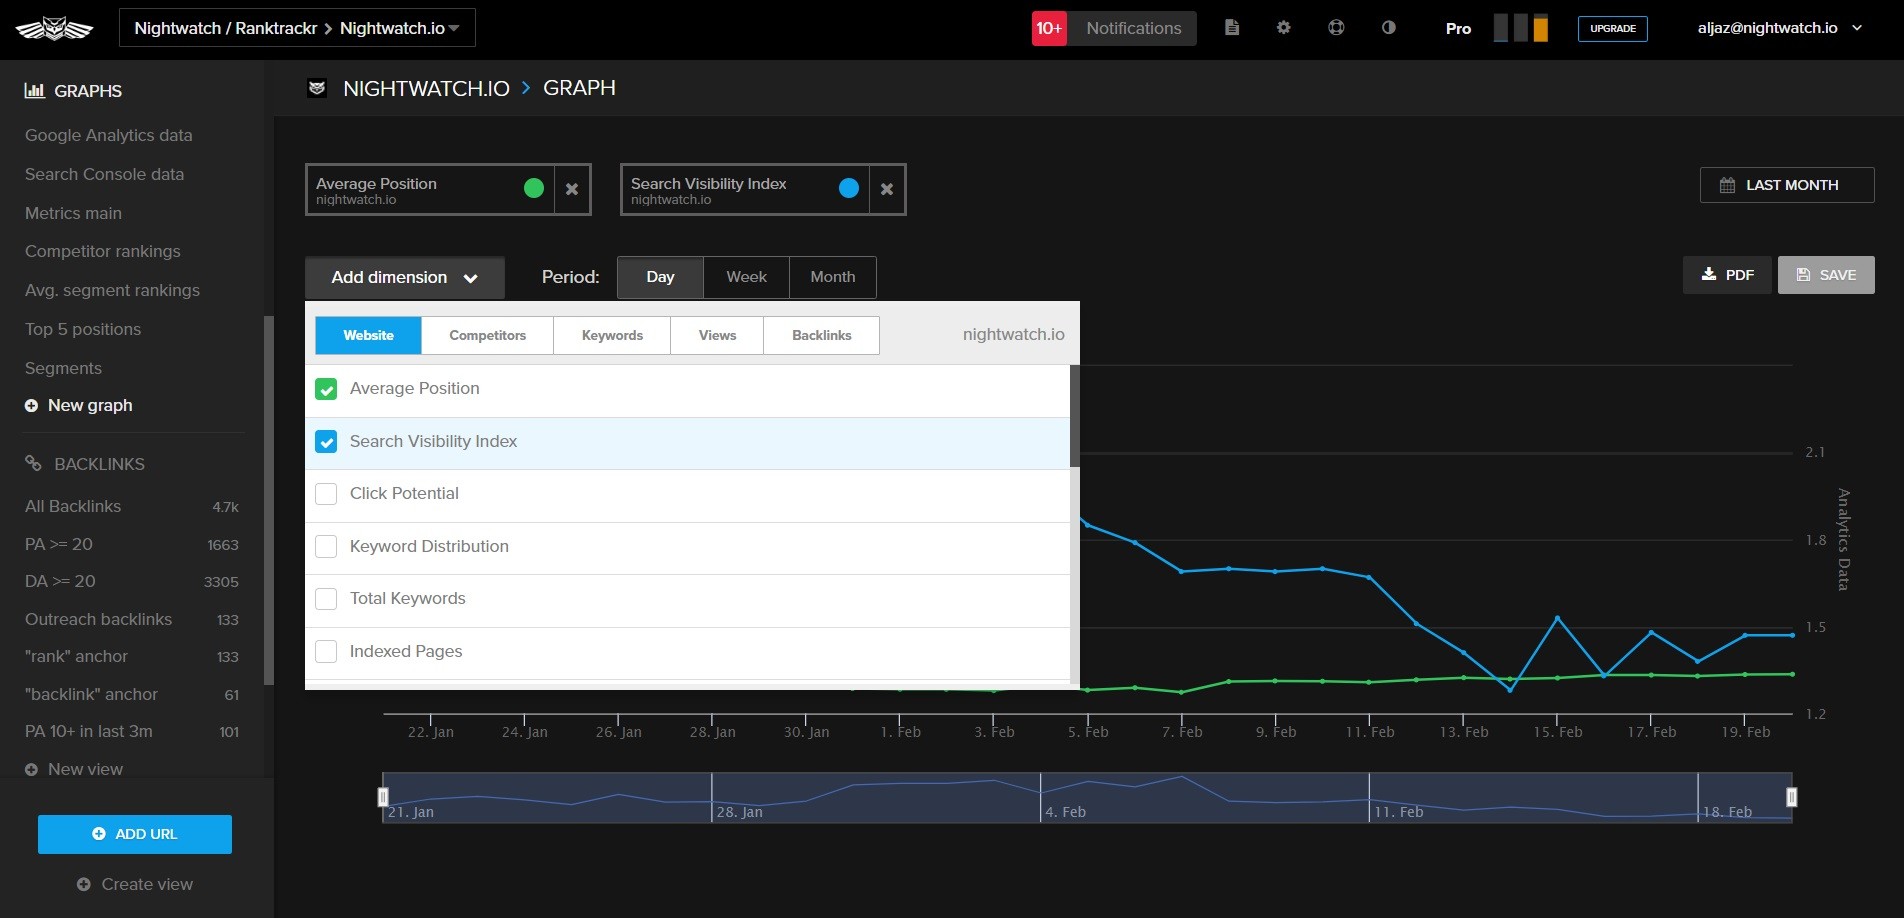
How to: On your Nightwatch graph, choose “Keyword distribution” under Website.
Average position
Average position tells you how your search rankings (overall) are improving. It is calculated as the sum of all rankings divided by the number of keywords that you’re tracking for a website. Every non-ranking keyword is used in the calculation as ranking the lowest on the scale (100).
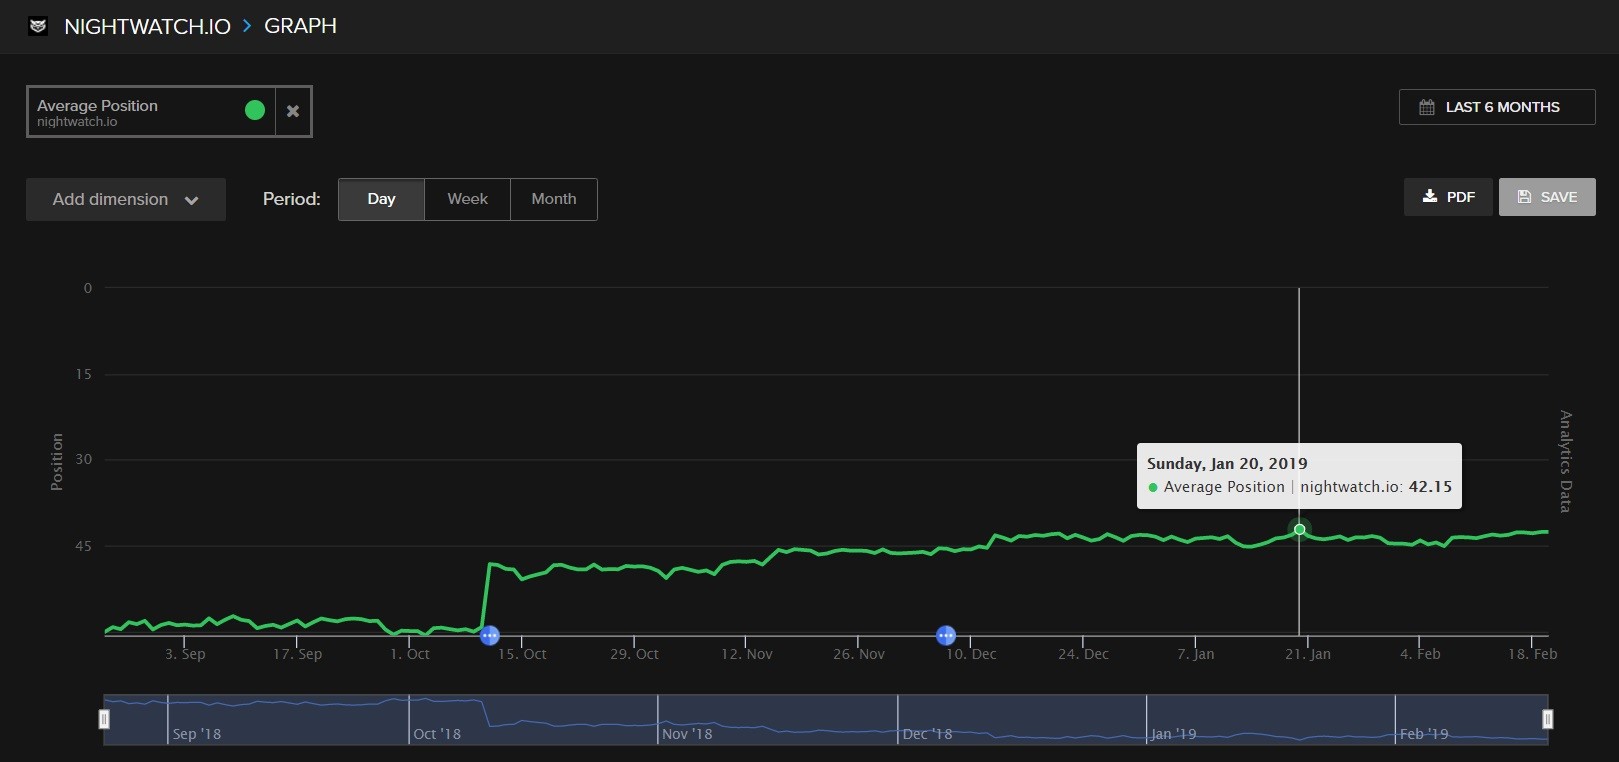
How to: On your Nightwatch graph, select “Average rank” under Website. Another dimension you can put on the same graph is the total number of tracked keywords because the average rank is likely going to change when you add or remove tracked keywords.
Average position of keyword segments
You probably already know that branded keywords (the ones that contain include the brand name or a variation of it) have completely different characteristics in terms of user behavior and rankings. They have the highest CTR and rankings and the lowest bounce rates. Because users already know that they are looking for your brand specifically, branded keywords should be treated very differently.
Recently we wrote a comprehensive guide on keyword segmentation, and we strongly encourage you to take after and divide your keywords into separate lists based on their location, context, or search volume using Nightwatch Views.
This makes it easier to spot the most significant things affecting changes in your search visibility trends — and to make smart decisions by optimizing the segments that drive the most profitable traffic to your website.
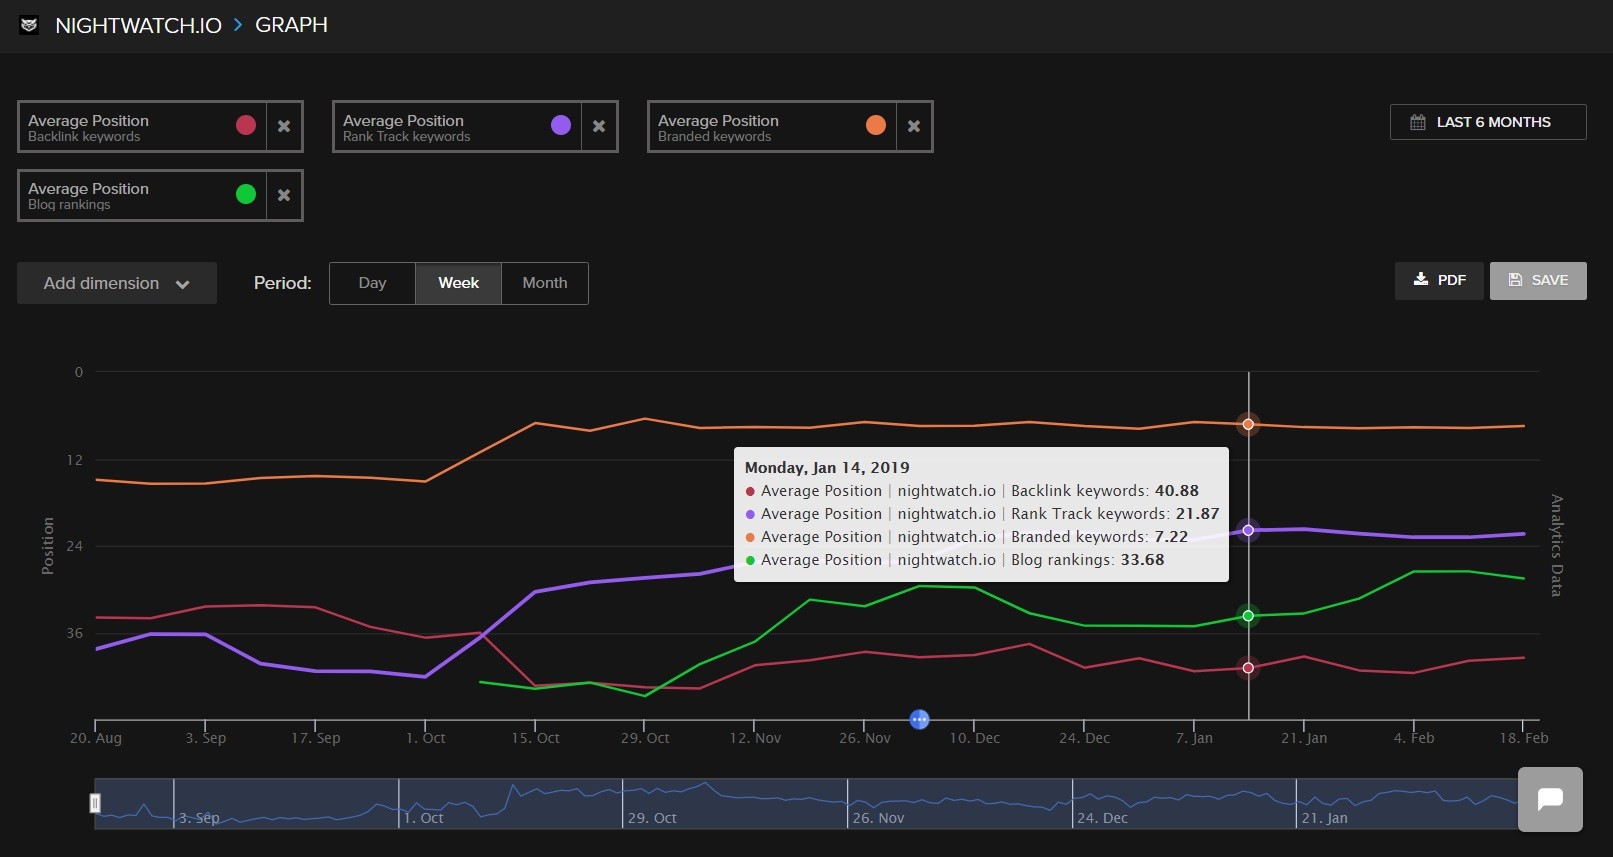
How to: After segmenting your keywords, go under Views and visualize each segment’s average position.
Average position compared with competitors
This is yet another variation of the previous graphs. To know who is doing best on the market, we need to observe the average positions of each of the competitors. For the best representation, we recommend selecting non-branded sets of keywords.
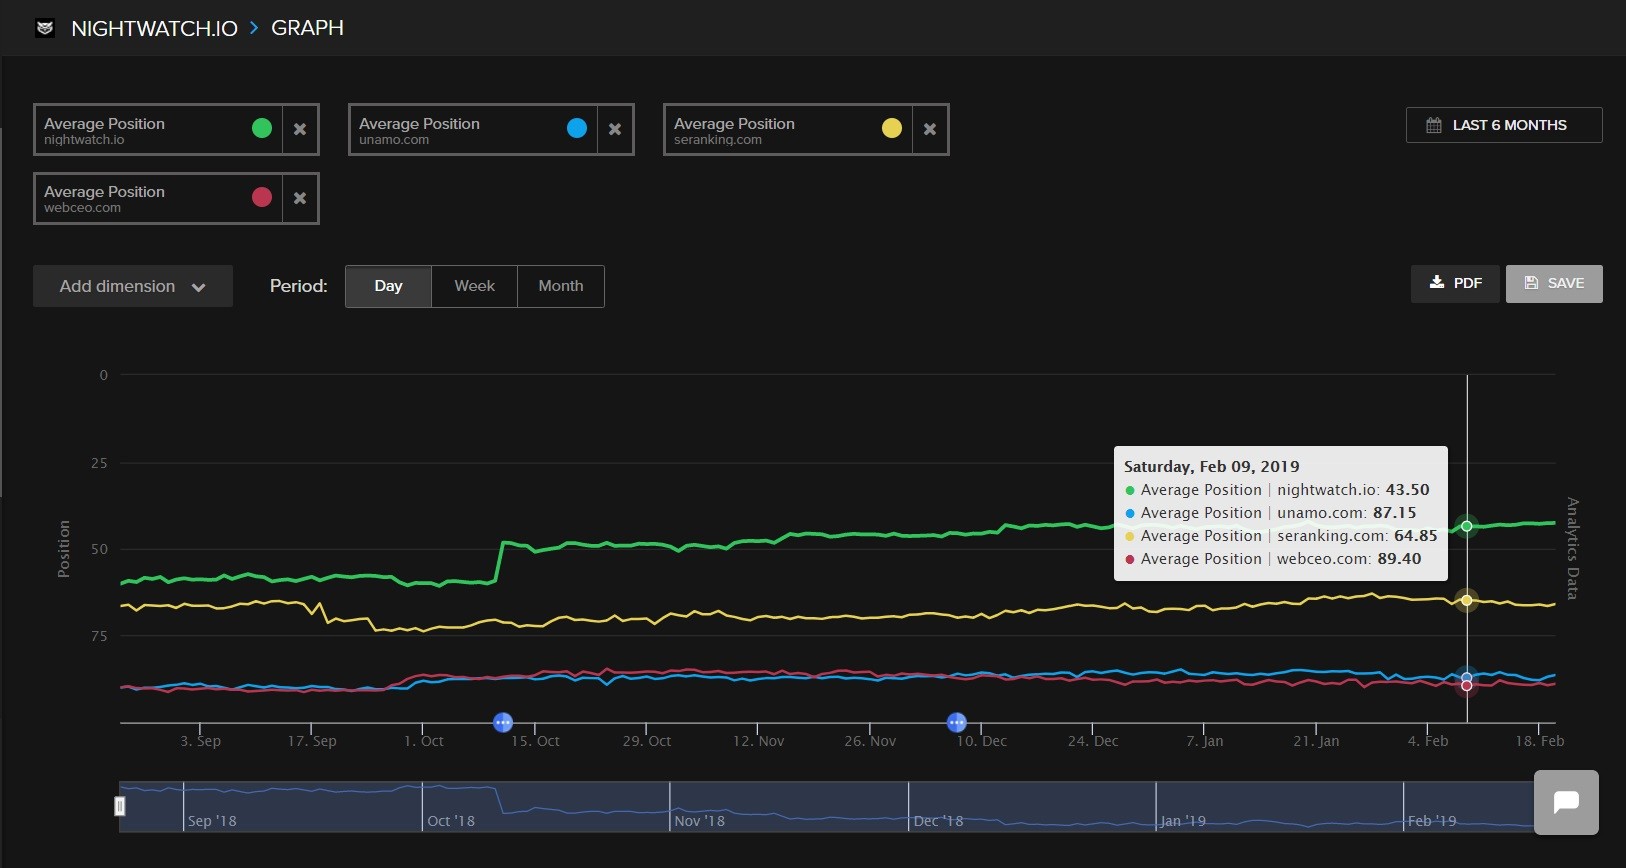
Make sure you research all the keywords that you and your competitors are ranking for to get a more precise idea of who is leading on the market. You can discover keywords and competitors in Nightwatch or do manual keyword research with Google Keyword Planner.
How to: Select your “Average position” under Website and add each of your competitors’ average positions under Competitors.
Number of indexed pages
In the ideal world, the number of indexed pages would grow linearly, and we’re getting there.
In the meantime, you can visualize the number of indexed pages on the graph to observe the healthy growth of your site pages and content. Or vice versa: if the number of indexed pages shown on Google search result page starts going down and you haven’t removed any pages from your site, this indicates that something is not going well.
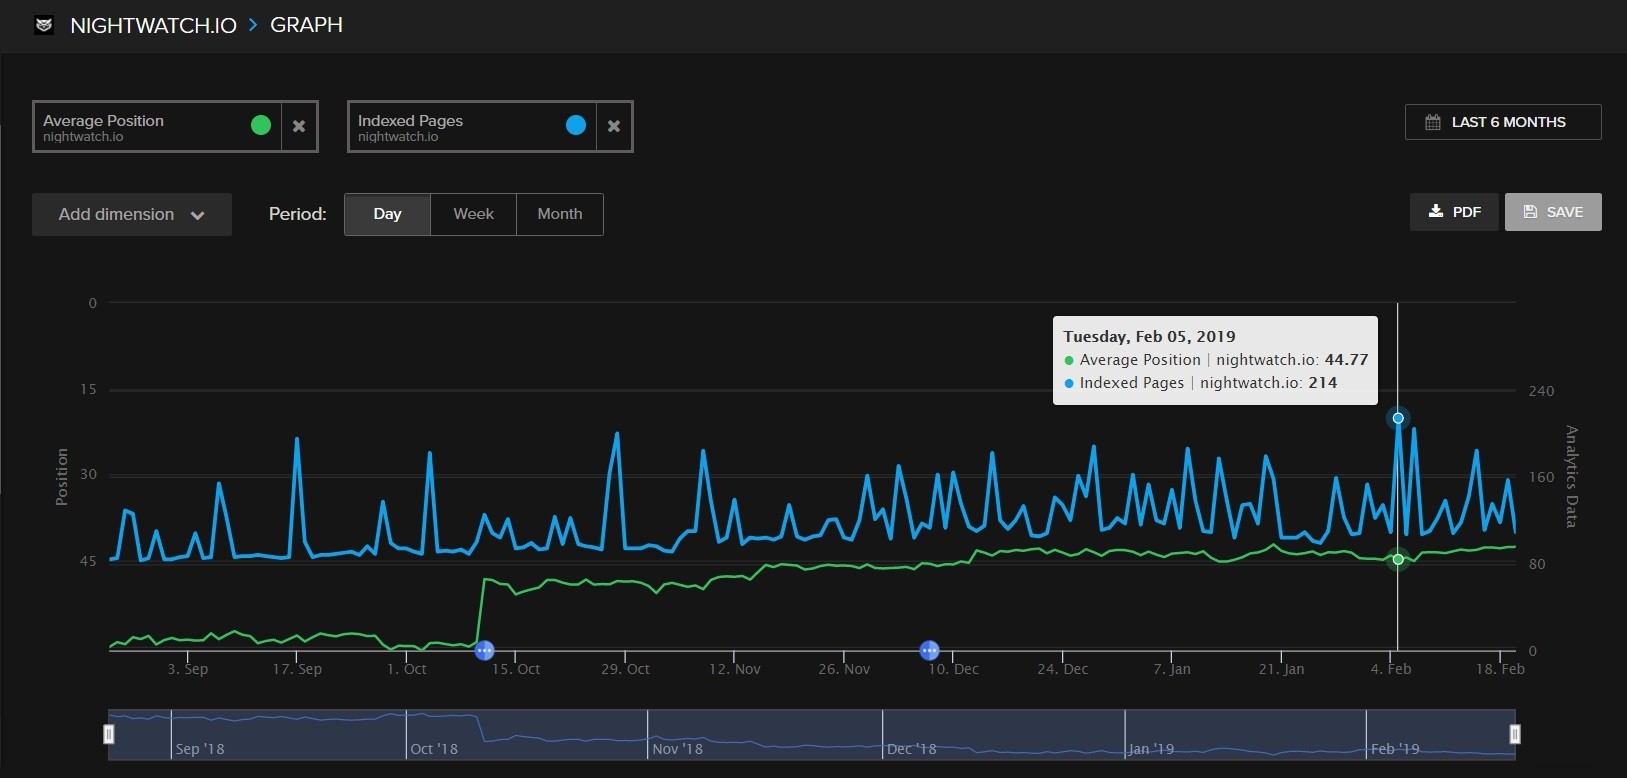
How to: On your Nightwatch graph, select “Indexed pages” under Website.
Search visibility index and click potential
These two metrics combined represent SEO traffic potential of your website.
Search visibility index refers to the percentage (values between 0 and 100) of a potential conversion traffic a given keyword (or set of keywords) has based on their ranking. Each rank is given a “visibility factor” number which is used to calculate the keyword’s share of potential conversions. Rank #1 is considered to attract all of the traffic, so its factor is one (100%), while lower rankings keywords are considered to result in fewer conversions, and their factors are proportional to their average CTR values.
Click potential tells you an estimated number of clicks you should be expecting based on your current rankings and search volume for the chosen keywords.
Your search visibility and click potential could also serve as an alternative to average position metric, with the difference that you should aim at the stable increase — even though reaching maximum of 100 with search visibility is unlikely to be achievable. The difference between average rank and search visibility is that the second one also takes search volume’s impact of the ranking keywords into the consideration, which makes it more accurate.
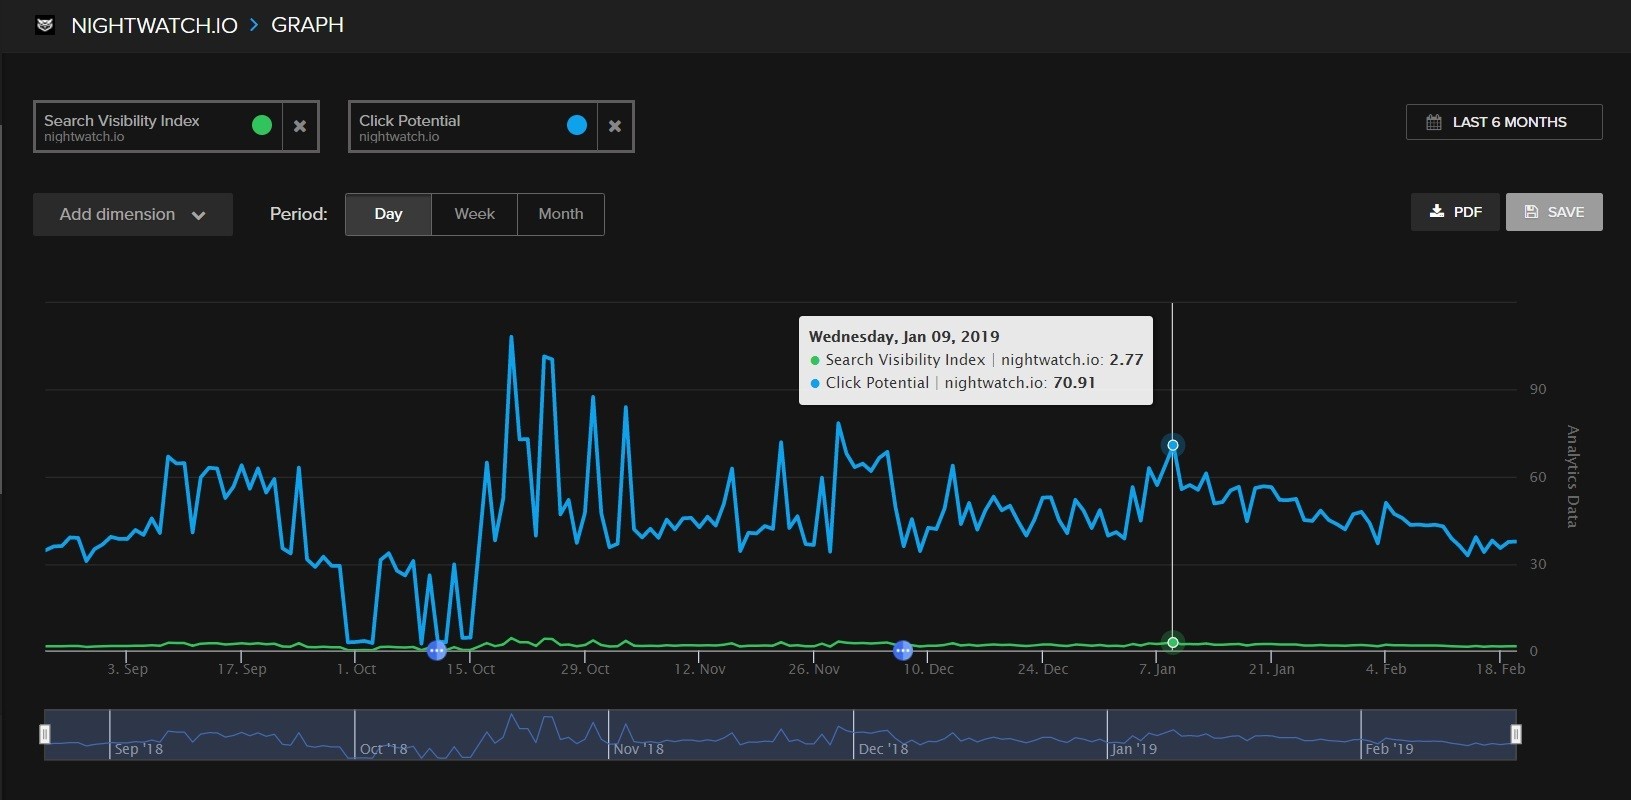
How to: On your Nightwatch graph, choose “Search Visibility Index” and “Click Potential” under Website.
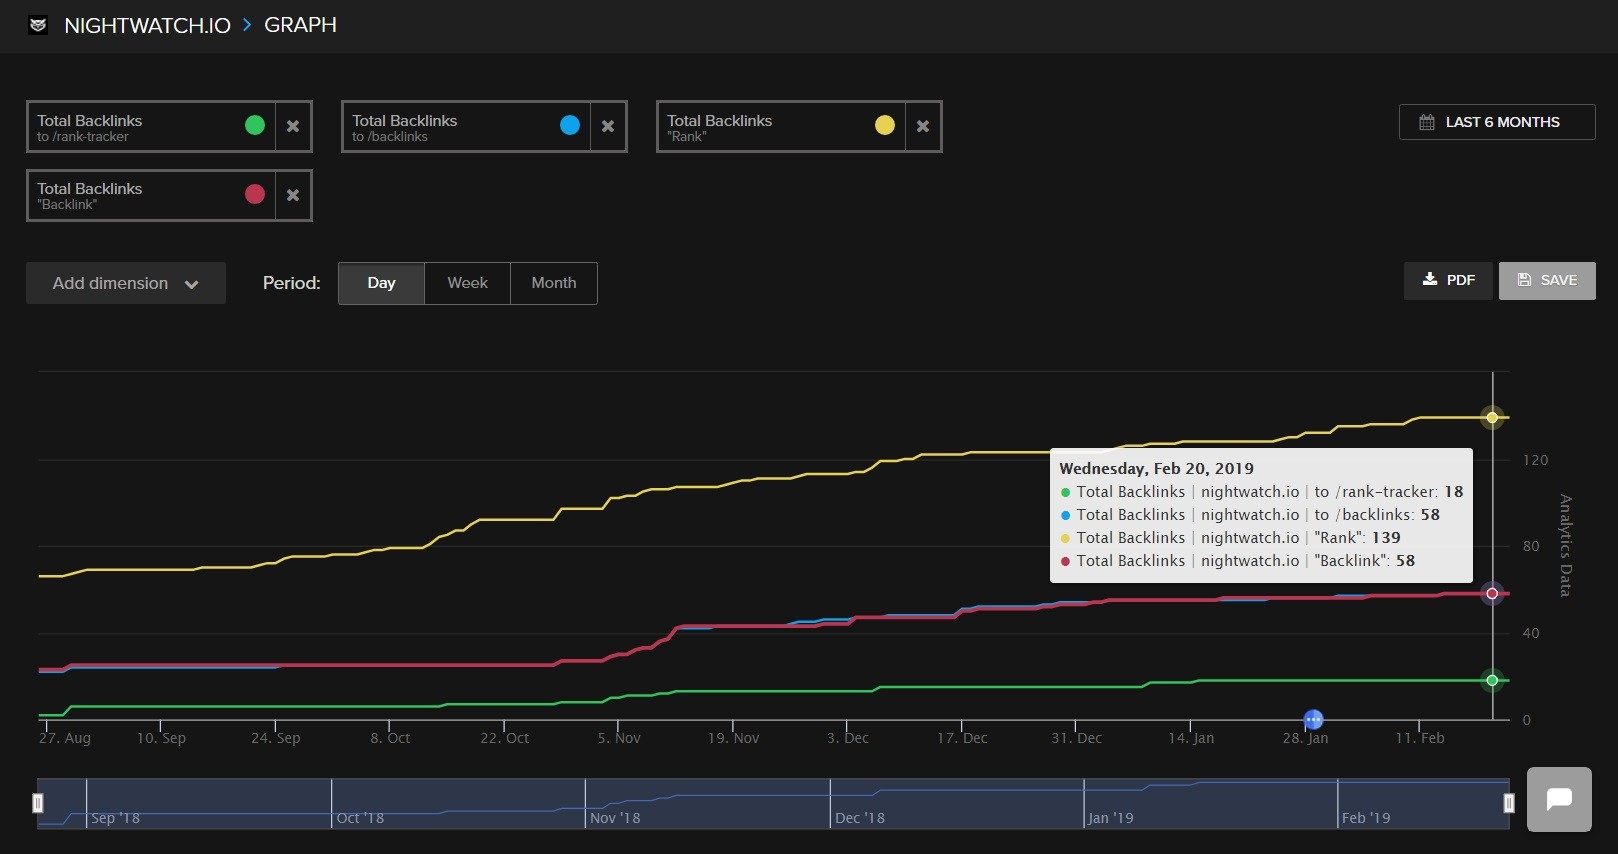
Total number of backlinks
This goes without saying: building high-quality backlinks improves your search visibility. You want to make sure here is that your total number of backlinks is growing steadily. As you analyze the numbers, you may also find a correlation with the growing average position, and it wouldn’t be a coincidence.
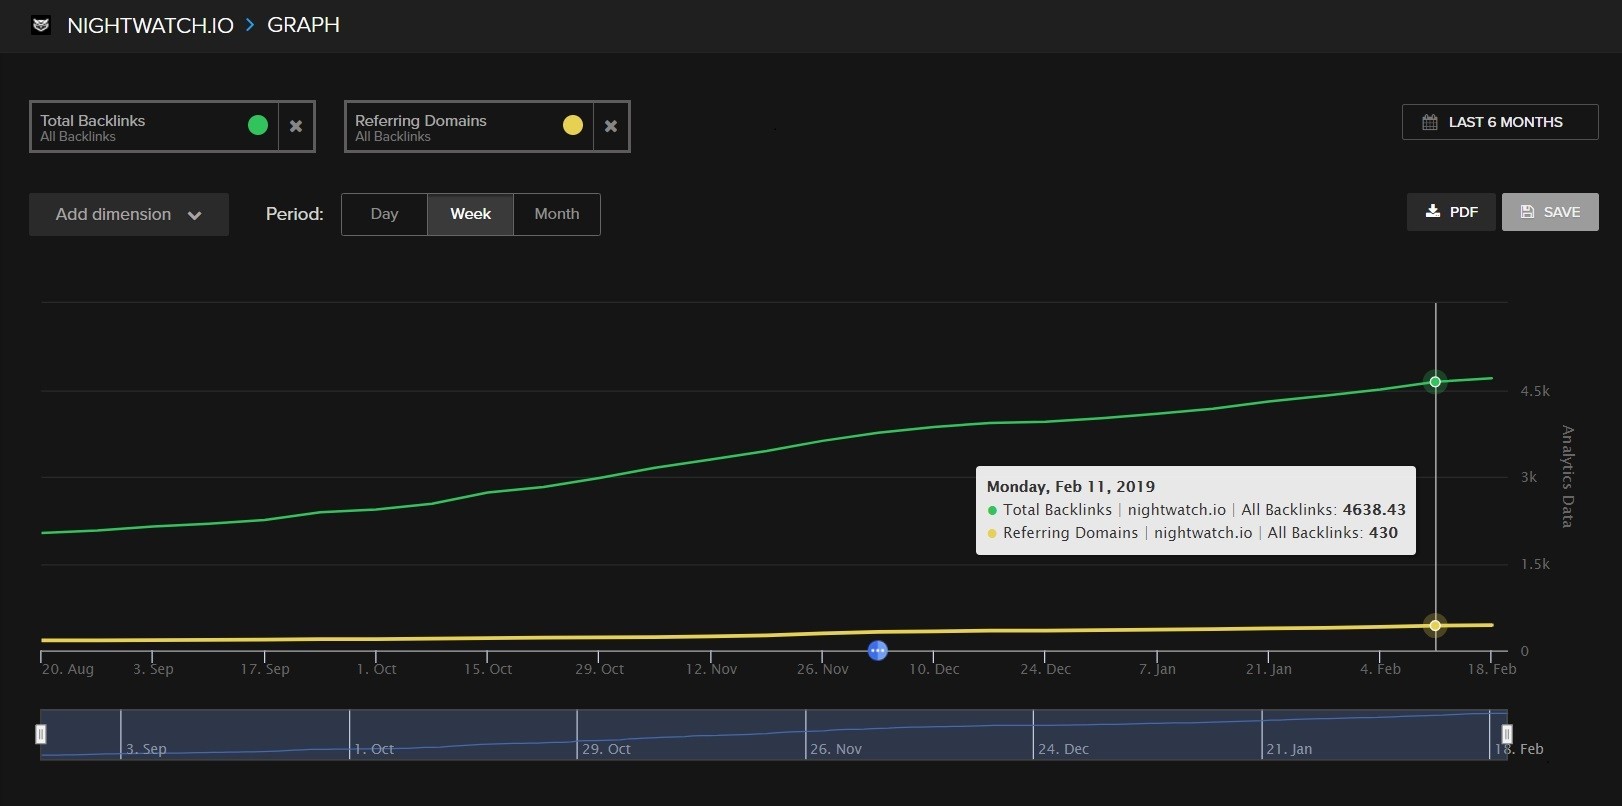
How to: On your Nightwatch graph, select “All backlinks” > “Total backlinks” under Backlinks.
Total number of backlinks on specific segments
Segmenting backlinks, just like segmenting keywords explained above, is a great way to organize your wild backlinks list. It gives you an idea of your link building efforts and backlink quality distribution as well as helps you focus on the segments you prioritize.
You can segment your backlinks depending on their quality, anchor text, time frame, which subpage do they lead to, or where they come from (for example, blogger outreach or local backlinks).
How to: Segment your backlinks first, for example, by their landing page:
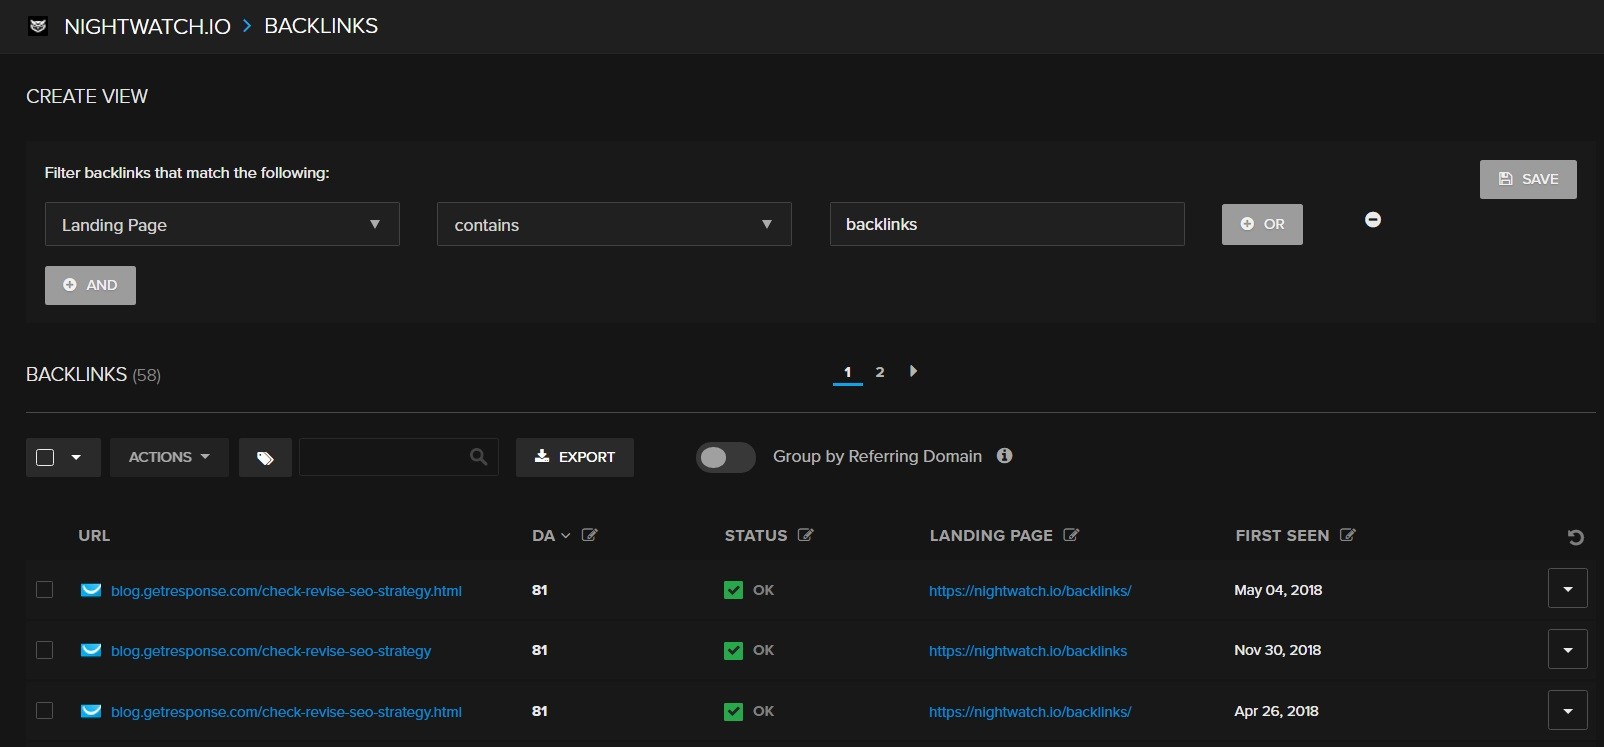
Then, go under Backlinks and select a View. Then, visualize the total number of backlinks for each View.
What’s next?
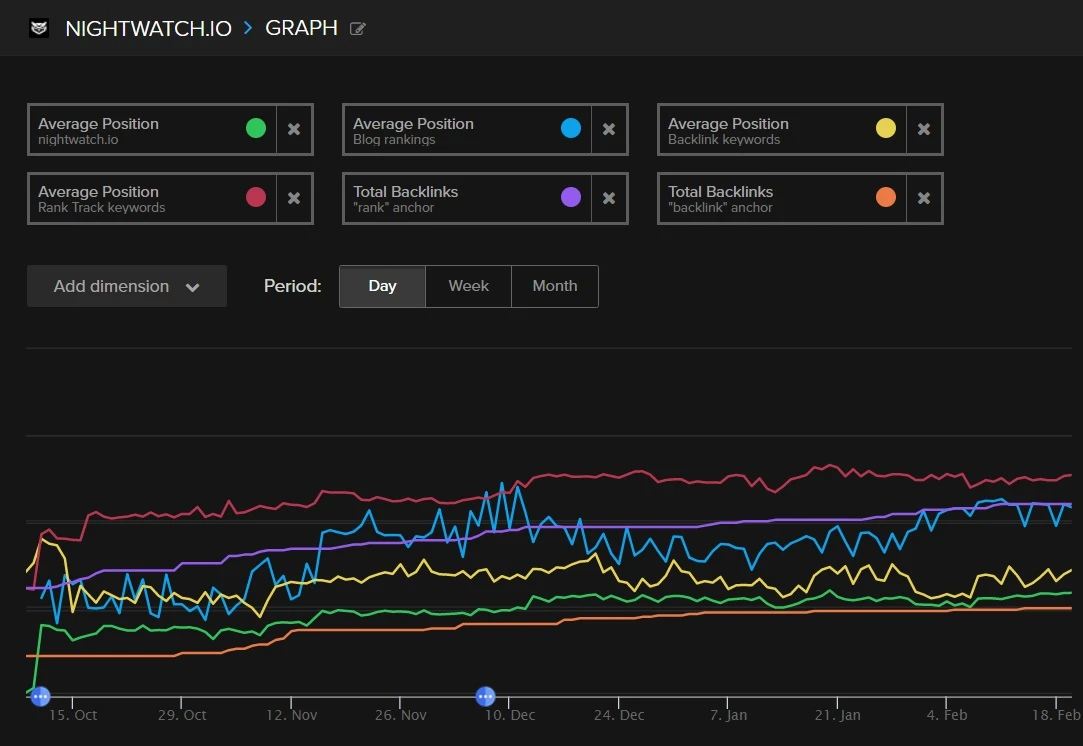
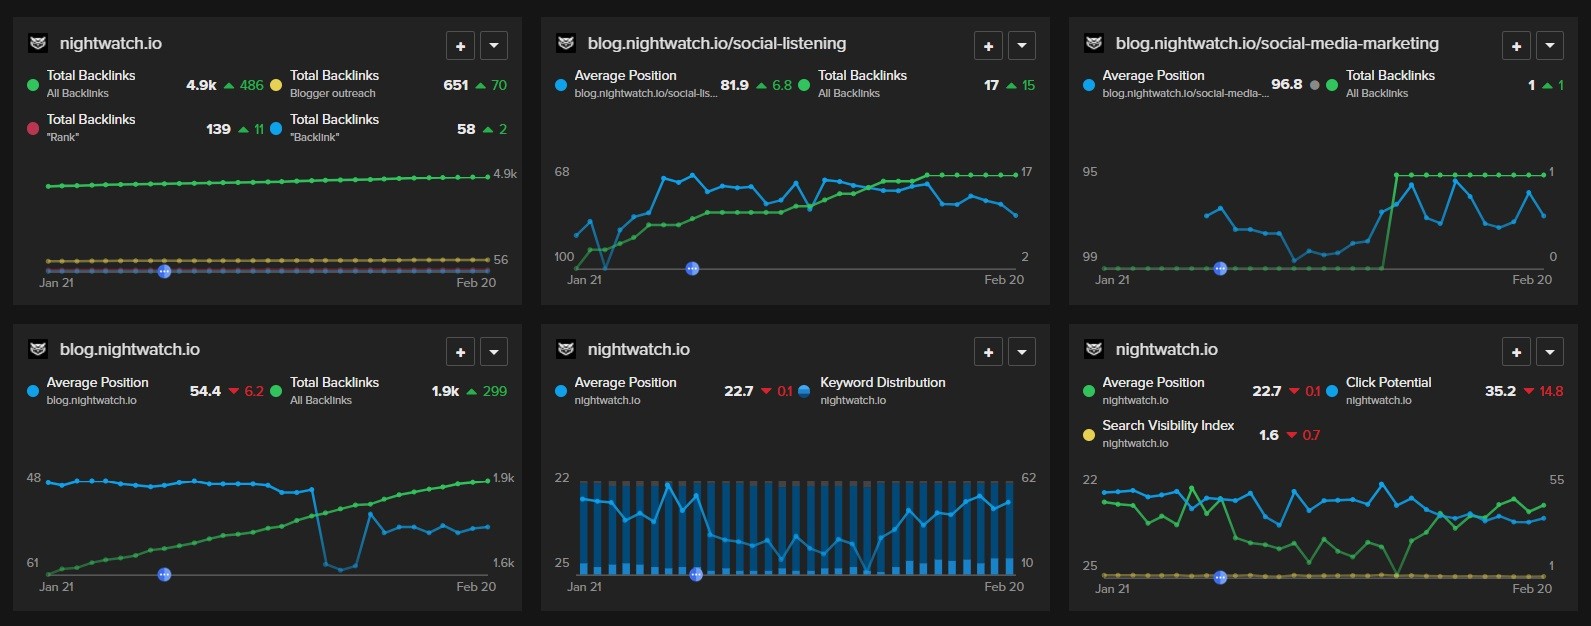
Keyword and backlink segmentation is like Marie Kondo of SEO: it not only keeps your graphs and Views tidy and organized but also helps you see your progress clearly without any distractions or noise. Here is how your graphs and backlink Views list could look like:
Now that you got familiar with the most essential SEO metrics, consider pinning them to your Nightwatch dashboard to have a nice overview every time you log in.
What is your current Nightwatch graphs setup? What SEO metrics are you focusing on? Let us know in the comments!
Newsletter
Subscribe to our newsletter
Join our newsletter to be the first to access Nightwatch's cutting-edge tools, exclusive blog updates, and fresh wiki insights. Transform your online presence today!